
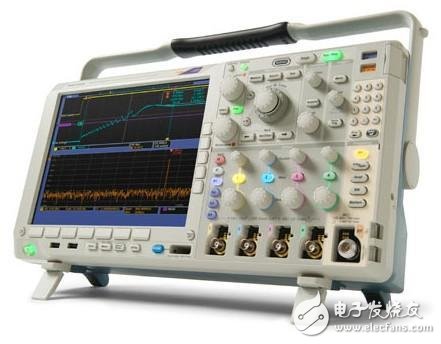
Oscilloscopes are electronic instruments used by electronic engineers as test and measurement. The oscilloscopes have experienced the era of analog oscilloscopes and digital oscilloscopes. Today, analog and digital oscilloscopes are suitable for most applications. So since the oscilloscope is so important, what is the role of the oscilloscope in our usual electronic test measurements, and what role does it play? Let's take a look at it.
First, the role of oscilloscope
1, can measure the voltage amplitude of DC signal, AC signal
2. The period of the AC signal can be measured and the frequency of the AC signal can be converted.
3. The waveform of the AC signal can be displayed.
4. Signal measurement can be performed separately with two channels.
5. The waveforms of the two signals can be displayed simultaneously on the screen, that is, the dual trace measurement function. This action measures the phase difference between the two signals and the difference in shape between the waveforms.
Second, the role of the oscilloscope panel knob
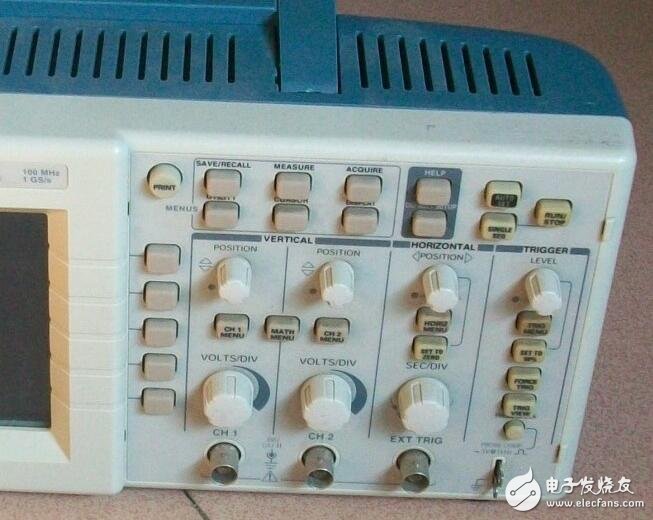
1. Scan the speed knob to change the speed at which the oscilloscope scan line moves from left to right.
2. The voltage selection knob can change the input voltage to make the deflection of the scan line in the Y-axis direction of the oscilloscope screen.
3. Adjust the knob and the left and right adjustment knobs to change the position of the scan line in the up, down, left and right directions of the screen.
4. The state in which the voltage standard knob reaches the maximum value in the clockwise direction is the standard state. Other locations are non-standard.
5. The state in which the scanning speed standard knob reaches the maximum value in the clockwise direction is the standard state. Other locations are non-standard.
6. For the synchronization knob, it can stabilize the waveform of the oscilloscope.
7. The function selection button is CH1 channel selection, CH2 channel selection, and dual trace action selection.
8. The function selection button is CH1 signal synchronization and CH2 signal synchronization.
9. Select the switch for the measurement function, which can make the measurement position and AC DC, DC AC, and ground GHD three states. When in DC DC state, both DC and AC signals can be measured. When in the AC AC state, the oscilloscope measures a capacitor on the internal string of the interface. At this time, the DC component of the signal is blocked by the capacitor, and the AC component can be measured by the capacitor.
When in the grounded state, the oscilloscope's measurement interface is shorted to ground inside the oscilloscope, and the external signal cannot enter the oscilloscope.
10. For the brightness adjustment knob, you can adjust the brightness of the image.
11. The focus adjustment knob can make the image fine.
Third, the oscilloscope frequency calculation
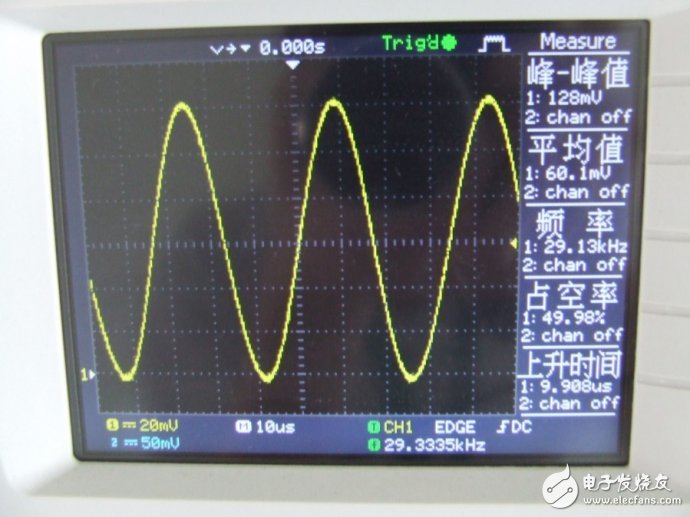
There are many ways to measure the signal frequency with an oscilloscope. The following two basic methods are commonly used.
Cycle method
For any periodic signal, the time interval T of each period can be measured by the above-mentioned measurement method of time interval, and the frequency f is obtained by the following formula: f=1/T
For example, the measured waveform displayed on the oscilloscope has a period of 8 div, the "t/div" switch is set to the "1μs" position, and the "fine adjustment" is set to the "calibration" position. Then its cycle and frequency are calculated as follows:
T=1us/div&TImes;8div = 8us
f= 1/8us =125kHz
Therefore, the frequency of the measured waveform is 125 kHz.
2. Li Shayu graphic method to measure frequency
Set the oscilloscope to XY mode, input the measured signal to the Y axis, input the standard frequency signal to “X externalâ€, and slowly change the standard frequency so that the two signal frequencies are integer multiples, such as fx:
Fy=1:2, a stable Lissajous figure will be formed on the screen.
The shape of the Lissajous figure is related not only to the phase of the two deflection voltages, but also to the frequency of the two deflection voltages. The tracing method can be used to draw the Lissajous figures of various frequency ratios and different phase differences of ux and uy. The Lissajous figures of several different frequency ratios are shown in Figure 5-15.
Using the relationship between the Lissajous figure and the frequency, an accurate frequency comparison can be performed to determine the frequency of the signal under test. The method is to lead the horizontal line and the vertical line respectively through the Lissajous figure, and the horizontal line of the horizontal line drawn does not pass through the intersection of the figure or the tangent. If the number of intersections between the horizontal line and the graph is m, and the number of intersections between the vertical line and the graph is n, then
Fy / fx=m / n
When the standard frequency fx (or fy) is known, the measured signal frequency fy (or fx) can be obtained from the above equation. Obviously, in the actual test work, when the frequency test is carried out with the Lissajous figure, in order to make the test simple and correct, the frequency of the known frequency signal is usually adjusted as much as possible, so that the graphic displayed on the screen is a circle or an ellipse. . At this time, the measured signal frequency is equal to the known signal frequency.
Since the two voltages applied to the oscilloscope have different phases, the pattern on the screen will have different shapes, but this has no effect on determining the unknown frequency.
The Lishayu graphic method is quite accurate in measuring the frequency, but the operation is time consuming. At the same time, it is only suitable for measuring signals with lower frequencies.
Textile Ceramic,Fabric Ceramic,Alumina Ceramic Guide,Ceramic Textile
Yixing Guangming Special Ceramics Co.,Ltd , https://www.yxgmtc.com