
The spectrum analyzer is mainly used for signal component analysis, and its application fields are quite extensive. It is involved in electromagnetic interference detection and analysis, radio communication, and satellite receiving systems. As far as the specific signal analysis method is concerned, the traditional time domain waveform analysis can visually observe the response changes of the amplitude, frequency and waveform of the signal, but it is limited to the low frequency signal, and the time domain analysis under the high speed signal has certain defects. Spectrum analysis refers to an analysis method that displays the frequency, amplitude and other information of a signal in the frequency domain. It performs Fourier transform on any signal, and then decomposes it into several single harmonic components to study. The frequency structure of the signal and the amplitude and phase information of each harmonic are very significant for high frequency signals and complex signal analysis. It can be seen that the focus of the spectrum analyzer is the amplitude-frequency characteristic and the phase-frequency characteristic, especially the calculation of the amplitude-frequency characteristic.
1. Core original theory certificateFor the spectrum analyzer, there are three main ideas for the specific implementation principle: multi-channel parallel filtering, swept heterodyne analysis, and direct FFT.
1.1, multi-channel parallel filteringThe core of the multi-channel parallel filtering scheme is the fabrication of multiple filters. The main idea is to divide the whole frequency band into several bandpass filters with no passbands (or partial overlap). The transition band bandwidth of these filters Even the maximum allowable attenuation of the passband is almost the same, only the passband frequency range is inconsistent. After the signals are sent to each filter in parallel, energy detection is performed for each of the filtered outputs to further determine the signal amplitude of each frequency band, and a spectrum map is drawn. Obviously, only the filter corresponding to the frequency band of the harmonic component, the output signal can collect the energy value, and the energy value increases as the harmonic component increases. The disadvantage of this traditional analog spectrum analyzer is that it relies too much on the construction of analog circuits, the hardware requirements are very high, and it is easy to produce insufficient frequency resolution accuracy or even measurement error.
1.2, sweeping heterodyne analysisThe core of the sweeping heterodyne analysis is the design of the mixing module. The main idea is to use a local oscillator with continuous sweeping frequency to generate the local oscillator signal and the measured signal, so that the harmonic components of the measured signal will always be met. There is an opportunity to fall into the passband of the subsequent IF filter. If the amplitude of the local oscillator signal remains unchanged, then the output of the mixer, the output of the intermediate frequency filter, and the output of the detector module are proportional to the amplitude of the corresponding harmonic component of the signal under test. Taking the control voltage of the sweeper (generally linear) and the output voltage of the detector module as X and Y signals, respectively, the amplitude-frequency characteristic of the signal under test can be obtained. This scheme actually replaces the parallel filtering function with the sweeping heterodyne function, which reduces the hardware requirements and improves the system performance.
1.3, direct FFTThe core of the direct FFT scheme is the calculation of high-speed FFT (FastFourierTransform). Conventional single-chip microcomputer systems such as ARM cannot be completed. It must rely on field-programmable gate array (FPGA) and other development systems suitable for high-speed signal processing. The main idea is to After the signal is waveform-conditioned, it is sent to the high-speed AD sampling chip, and the acquired signal is intercepted by a short-time window for FFT calculation, and the calculation result is directly output as an amplitude-frequency characteristic map and a phase-frequency characteristic map. Obviously, this solution also has the difficulty that the sampling frequency of the AD chip is higher, but if there is a suitable AD chip, the digital spectrum analyzer will have a higher fault tolerance than the analog spectrum analyzer. Technical indicators such as frequency detection range and frequency resolution will also be greatly optimized.
2, the overall system designThe simple digital spectrum analyzer is mainly composed of a signal acquisition module, a high-speed FFT module and an LCD display module. The signal acquisition module takes the AD9226 chip as the core and cooperates with the pre-aliasing anti-aliasing filter circuit to realize signal acquisition; the high-speed FFT module is realized by programming in the FPGA development system; the LCD display module selects the 4.3-inch TFT LCD screen to realize the visual interface. The system block diagram of the simple digital spectrum analyzer is shown in Figure 1.
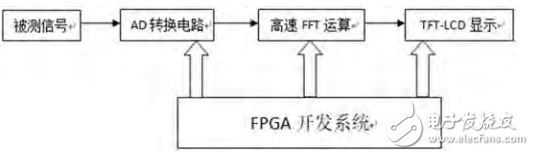
figure 1
Right Angle DIP Centronic Connector
Right Angle DIP Centronic Connector.
Current Rating:5A
Dielectric Withstanding Voltage:1000V for one minute
Insulation Resistance:1000MΩ Min.(at 500V DC)
Contact Resistance:35mΩ Max.
Temperature:-55°C to +105°C
Right Angle DIP Centronic Connector
ShenZhen Antenk Electronics Co,Ltd , https://www.antenkelec.com