
The research of smart antenna technology started in the 1960s. The initial research object was a radar antenna array, the main purpose of which was to improve the performance of the radar and the ability of electronic countermeasures. With the development of mobile communication and the gradual in-depth research on mobile communication radio wave propagation, networking technology, antenna theory, etc., the processing capabilities of digital signal processing chips continue to improve, and it is possible to use digital technology to form antenna beams in the baseband. In the 1990s, array processing technology was introduced into the mobile communication field, and a new research hotspot-smart antennas was quickly formed. Among them, my country has successfully introduced smart antenna technology in the TD-SCDMA technology that enjoys independent intellectual property rights. To some extent, smart antennas are one of the key signs that distinguish 3G from 2G systems.
Smart antennas use digital signal processing technology to generate spatially directional beams, so that the main beam of the antenna tracks the direction of user signal arrival, side lobes or nulls are aligned with the direction of arrival of interference signals, and the spatial orthogonality of multiple antenna elements and signals are transmitted. The difference in direction distinguishes the signals of the same frequency or the same time slot and the same code channel, and maximizes the use of limited channel resources. It has unique advantages in improving system communication quality, alleviating the contradiction between the increasing development of wireless communication services and insufficient spectrum resources, as well as reducing the overall cost of the system and improving system management.
Since smart antennas have so many benefits, as the pace of commercialization of the TD-SCDMA system is getting closer, smart antenna technology, one of the key technologies of the TD-SCDMA system, has also received more and more attention. Therefore, The test method of the smart antenna is also very important.
2. Classification of smart antennasSmart antennas can be divided into omnidirectional smart antenna arrays and directional smart antenna arrays according to their types.
For the directional smart antenna array, the following three types of test parameters are included.
(1) Circuit parameters. Including the preset value of the vertical electric downtilt angle, the accuracy of the vertical electric downtilt angle, the vertical mechanical downtilt range; the input impedance, the standing wave ratio of each unit port, the isolation of adjacent unit ports, and the continuous wave power capacity of each port.
(2) Calibration parameters. Including the coupling degree from the calibration port to each unit port, the maximum amplitude deviation from the calibration port to each unit port, the maximum phase deviation from the calibration port to each unit port, the standing wave ratio of the calibration port, and the coupling directivity of the calibration channel.
(3) Performance parameters. Including the active input return loss of each unit port, the vertical half-power beam width, the upper first side lobe suppression on the vertical surface and the lower first zero point filling; the unit beam horizontal half-power beam width, gain, front-to-back ratio cross polarization ratio (Axial) and cross polarization ratio (within ±60°); service beam horizontal plane half-power beam width, boresight gain, horizontal plane sidelobe level and front-to-back ratio, broadcast beam horizontal plane half-power beam width, boresight gain, apparent The axis gain Φ=±60° where the level drops, and the level fluctuations within the half-power beam width.
For the omnidirectional smart antenna array, it can also be divided into three types of test parameters.
(1) Circuit parameters. Including the preset value of the vertical electric downtilt angle, the accuracy of the vertical electric downtilt angle; the input impedance, the standing wave ratio of each unit port, the isolation of adjacent unit ports, and the continuous wave power capacity of each port.
(2) Calibration parameters. Including the coupling degree from the calibration port to each unit port, the maximum amplitude deviation from the calibration port to each unit port, the maximum phase deviation from the calibration port to each unit port, the standing wave ratio of the calibration port, and the coupling directivity of the calibration channel.
(3) Performance parameters. Including the active input return loss of each unit port, the vertical half-power beam width, the upper first side lobe suppression on the vertical surface and the lower first zero point filling; the unit beam horizontal half-power beam width, gain, front-to-back ratio cross polarization ratio (Axial) and cross-polarization ratio (within ±60°); service beam horizontal plane half-power beam width, boresight gain, horizontal sidelobe level, broadcast beam boresight gain, pattern roundness.
3. Test items and test methods of smart antennasThe following describes the test items of smart antennas that are different from ordinary antennas.
First of all, smart antennas have more calibration ports than ordinary antennas, mainly to dynamically calibrate the consistency of the amplitude and phase of each unit port. The accuracy of the calibration directly determines the application effect of the smart antenna. Therefore, the calibration port to each The maximum deviation of the unit port amplitude and the maximum deviation of the phase from the calibration port to each unit port put forward corresponding requirements. During the test, the calibration port and each feed port form a calibration channel, and the phase/amplitude error can be obtained by measuring any port. The maximum deviation between all measured values ​​at the same frequency point is taken to obtain this indicator.
The measurement of the calibration circuit parameters is shown in Figure 1.
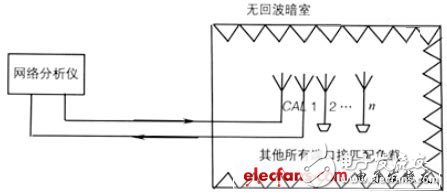
figure 1
The measurement steps are as follows:
(1) Install the tested antenna in a free space or simulated free space that meets the measurement conditions;
(2) Carry out system calibration according to the requirements of the measurement system;
(3) Connect the measurement system to the calibration port of the tested antenna and the i-th feed port, and all other ports of the tested antenna are connected to a matching load, and the transmission coefficient S (i, CAL) is measured within the working frequency range ï¼›
(4) Repeat step (3) to test the S (i, CAL) values ​​of all ports.
After measuring the transmission coefficient S (i, CAL) from the calibration port CAL to the multiple radiation ports i, calculate the modulus and phase angle of all the tested S (i, CAL) values ​​respectively, and draw all the modulus curves and phase angle curves separately In the two figures, compare and find the maximum mode (ie amplitude) deviation and phase deviation respectively.
Secondly, it is the active input return loss of each unit port.
The difference between active input return loss and ordinary return loss is that it is the return loss when each unit port has an input signal and forms beams in different directions, so it is called active input return. Wave loss, the measurement schematic is shown in Figure 2.
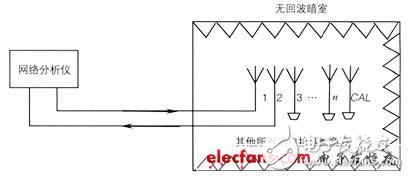
figure 2
The steps for indirect measurement of active input return loss are as follows:
(1) Install the tested antenna in a free space or simulated free space that meets the measurement conditions;
(2) Carry out system calibration according to the requirements of the measurement system;
(3) Connect the measurement system to the i-th feed port of the tested antenna, and all other ports of the tested antenna are connected to a matching load. The complex reflection coefficient Sii is measured within the working frequency range. The measured Sii reading is the first The self-reflection coefficient of i feed ports;
(4) Connect the measurement system to the i-th and j-th feed ports of the tested antenna, and all other ports of the tested antenna are connected to a matching load, and the transmission coefficient Sij is measured within the working frequency range, and the tested Sij The reading is the transmission coefficient from the j-th feeding port to the i-th feeding port;
(5) Repeat steps (3) and (4) to measure the values ​​of Sii and Sij for all ports;
(6) According to the matrix formula: [b]=[S][a], the reflection signal bi corresponding to any amplitude/phase excitation ai can be obtained, and the complex reflection coefficient Γi=bi/ai of the i-th radiation port can be obtained ,According to the complex reflection coefficient, the corresponding active input return loss of the i-th feed port can be calculated as 20lg (Γi);
(7) Find the maximum value of the active return loss of all radiating ports;
(8) Repeat step (6) to provide amplitude/phase excitation ai with scan angles of 0°, ±30°, ±45°, ±55°, find the corresponding active return loss, repeat step (7), find The maximum value of all active return loss.
Third, smart antennas have increased the concept of unit beams, broadcast beams, and service beams than other antennas.
The unit beam refers to the radiation pattern emitted or received by any feed port in the smart antenna array when all other ports are connected to a matching load. For smart antennas, the index requirements of unit beams are not much different from those of ordinary antennas, so I will not focus on them here.
Broadcast beam refers to the radiation pattern of omnidirectional coverage or sector coverage formed by applying specific amplitude and phase excitation to the smart antenna array.
For directional smart antennas, the broadcast beam can be divided into 30°, 65°, 90° and 100°, corresponding to the coverage requirements of different sectors. For omnidirectional smart antennas, the broadcast beam should cover 360°, so corresponding requirements are put forward for its roundness.
Different antenna manufacturers, due to different processes and design methods, have different amplitude and phase weighting coefficients for broadcast beams. Therefore, antenna manufacturers are required to provide corresponding amplitude and phase weighting coefficients for different broadcast beams.
The service beam refers to a pattern formed by applying a specific amplitude and phase excitation to a smart antenna array with arbitrary beam directional scanning in the working angle domain and a narrow beam with high gain.
The first beam of the directional smart antenna refers to the beam obtained by inputting equal amplitude and in-phase signals at the antenna port; the other is that the excitation amplitude of each column unit is uniform and the excitation phase is linearly increasing (the differential phase is defined as, where: The gain obtained when the wavelength of the center frequency point of the working frequency band, d is the horizontal distance between adjacent columns, = 60°).
For the first beam of an omnidirectional smart antenna, follow the following formula:
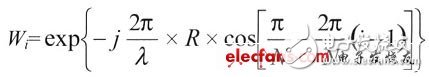
Among them, i=1, 2,...N, N=8 (for 8 arrays).
Calculate the amplitude and phase of the corresponding antenna port, and then perform excitation to obtain the first beam, which is the center frequency of each operating frequency band.
Taking gain measurement as an example, the unit beam, service beam and broadcast beam can all be tested using the test block diagram shown in Figure 3.
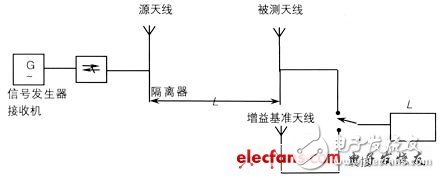
The test conditions are as follows.
(1) The antenna under test and the source antenna have the same polarization mode.
(2) The measurement distance between the tested antenna and the source antenna should meet
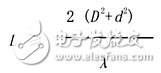
Where: L——The distance between the source antenna and the antenna under test (m);
D——Maximum size of tested antenna (m);
d——Maximum radiation size of source antenna (m);
——Test frequency wavelength (m).
(3) The tested antenna should be installed in an area where the field strength is basically uniform. The field strength should be tested in advance with a half-wave dipole antenna within the effective antenna volume of the tested antenna. If the electric field change exceeds 1.5 dB, the test is considered The field is not available; in addition, the difference in field strength measured by the gain reference antenna on the two orthogonal polarization planes should be less than 1 dB.
(4) Measurement equipment and instruments such as signal generators and receivers for measurement shall have good stability, reliability, dynamic range and measurement accuracy to ensure the correctness of the measurement data. The measuring instrument should have a measurement certificate and be within the calibration period.
Before the measurement starts, the antenna array amplitude-phase weighted feed network corresponding to the measured parameters should be prepared. While confirming the amplitude-phase weighted value, it is necessary to connect the matched load to the non-tested network unit, respectively. Measure the modulus |Si,j| (dB) of the transmission coefficient from the total feed input port to the input port of each array unit, and use the formula:
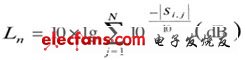
(Where N is the number of feed ports of the array unit), find the insertion loss Ln of the antenna array weighted feed network corresponding to the measured parameter.
At the beginning of the measurement, the tested antenna and the gain reference antenna must be adjusted alternately in level and elevation to ensure the best orientation of each antenna in the level and elevation so that the received power level is maximized.
The measurement steps are as follows
(1) The gain reference antenna is aligned with the source antenna, and the gain reference antenna is connected to the receiver through switching. At this time, the received power level of the receiver is P1 (dBm).
(2) The tested antenna is switched through the feed network with the weighting value required by the corresponding feed port, so that the tested antenna is connected to the receiver, and then it is aligned with the source antenna through measurement and adjustment. At this time, the receiver The received power level is P2 (dBm).
(3) Repeat steps (1) and (2) until the repeatability of P1 and P2 measurement reaches an acceptable level.
(4) The gain G of a certain frequency point of the tested antenna is calculated as follows:
G=G0+(P2-P1)+N where:
G0-the gain of the reference antenna (dBi);
N——The correction value (dB) of the channel loss from the input of the receiver to the output of the antenna under test and the output of the gain reference antenna after the insertion loss Ln of the corresponding antenna array weighted feed network is accounted for.
(5) In the same working frequency band, measure the three frequency points of high, medium and low, and calculate the average value of decibels.
(6) According to the different gain definitions in the electrical performance requirements, set the amplitude-phase weighted value of each output port of the array feed network, first measure the corresponding insertion loss of the feed network, and then repeat steps (4) and (5), Carry out the corresponding gain test respectively.
The performance criterion is
For each operating frequency band, the three frequency points of high, medium and low are tested. The average value should meet the requirements of the gain index, and the worst value of the three frequency points of high, medium and low shall not be less than the gain index of 1.0. Otherwise, it is judged as unqualified.
The measurement methods of pattern roundness (omnidirectional antenna), half-power beam width, front-to-rear ratio, cross-polarization ratio and antenna electrical downtilt angle can also be carried out with reference to the gain test block diagram and test steps, which will not be described in detail here. Up.
4. SummaryThe complexity of smart antenna testing is much more complicated than that of ordinary antennas. Only when the above tests are done can the performance of smart antennas be comprehensively evaluated and the advantages of smart antennas can be brought into full play.
32v DC Power Supply is applicable to electrical equipment testing sector. The output current for 1U unit and 2U unit is up to 50A and 200A respectively.
It also covers 12v dc power supply, have the features including high precision and resolution,high efficiency low ripple ,complete multiple protection (OVP/OCP/OPP/OTP/SCP), Master/Slave Series/Parallel modes up to 10 units, and multiple communication interfaces,which allow a more flexible and convenient use of the programmable power supply.
Some features of the dc power supply as below:
- Ultrafast respond time
- Accurate voltage and current measurement capability
- Constant Power and wide range of voltage and current output
- Equips with LIST waveform editing function
- Compliant with SCPI communication protocol
- Built-in standard automobile electrical testing curves
- Support RS232/RS485/LAN/USB (standard) ,GPIB (optional)
- Voltage drop compensation by remote sense line.
- Have obtained CE,UL,CSA,FCC.ROHS
32V DC Power Supply,Adjustable DC Power Supply,Switching Power Supply,Computer Power Supply
APM Technologies Ltd , https://www.apmpowersupply.com